Analysis Instruction
#Shrinkage and creep prediction function
In order to provide users with a way to quickly calculate shrinkage and creep data for practical applications, this webpage provides data forecasting and downloading functions for various prediction models, which can be divided into three steps.
1.Choose the type of concrete you want to analyze. This page provides four types of concrete, including compacted concrete, self-compacting concrete, steel fiber compacted concrete and steel fiber self-compacting concrete.
2.Choose the prediction formula you want to use. This page provides a variety both local and international specifications, including ACI 209R-92, AASHTO, CEB MC90, CEB MC90-99, CEB MC10, GL2000, FIB2000, JSCE1996, JSCE2002, Model B3, Model B4 , Model CCL and Model B4TW and machine learning algorithms, including Decision Tree, ExTra Tree, Random Forest, Extra Trees, Gradient Boosting Regressor and XGBoost, etc. In order to facilitate the comparison of the analysis results of different forecasting models, users are here to choose multiple forecasting models at once.
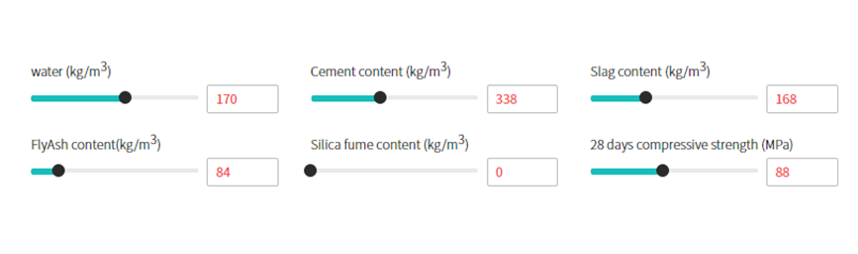
3.Enter the ratio parameters, geometric parameters and environmental parameters required for the calculation, such as cement volume, aggregate content, relative humidity, geometric shape, etc. This page provides two input methods for users to choose, including direct input of values and self adjustment of the slot slider.
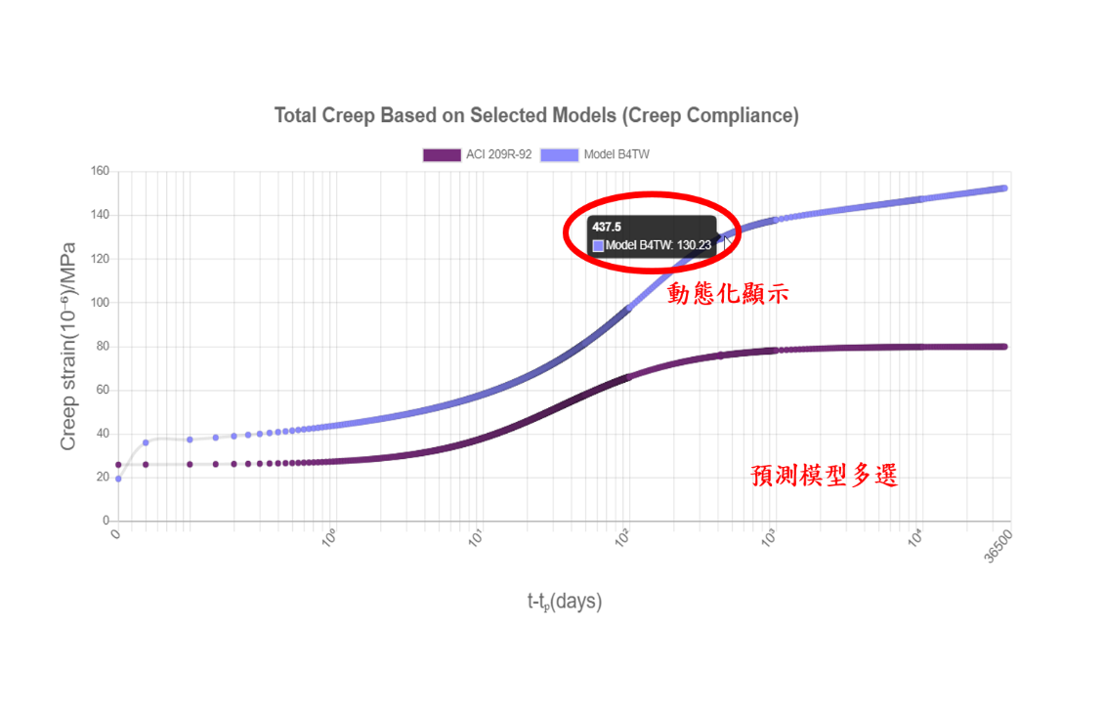
After completion, the web page will be connected to the corresponding Python code for analysis and calculation. The results of the analysis will be drawn as a graph with the horizontal axis as time and the vertical axis as the strain value of shrinkage or creep, including two representations of creep flexibility function and creep coefficient. In order to make it easier for users to use the analysis results, this page will provide the function of displaying the value of the dynamic cursor. Move the cursor to the point on the analysis result curve that you want to know to get the coordinate value of the point; this page will also provide the CSV file download of the predicted value. All time points and their predicted values will be stored in the CSV file in two columns, so that users can easily use the forecast data in various analysis software.
#收縮與潛變預測功能
為提供使用者一種能迅速計算出收縮及潛變數據,以利於實務上之應用,本網頁提供各種預測模型之數據預測與下載之功能,其主要可分為三步驟。
1.選擇欲分析之混凝土種類,本網頁皆提供四種混凝土類型,包含搗實混凝土、自充填混凝土、鋼纖維搗實混凝土與鋼纖維自充填混凝土。
2.選擇欲使用之預測公式,本網頁提供多種國內外之規範,包含ACI 209R-92、AASHTO、CEB MC90、CEB MC90-99、CEB MC10、GL2000、FIB2000、JSCE1996、JSCE2002、Model B3、Model B4、Model CCL和Model B4TW與機器學習演算法,包含Decision Tree、ExTra Tree、Random Forest、Extra Trees、Gradient Boosting Regressor與XGBoost等。為方便比較不同預測模型之分析成果,此處開放使用者一次選擇多種預測模型。
3.輸入計算所需之配比參數、幾何參數與環境參數,例如水泥量、骨材含量、相對濕度、幾何形狀等等。此網頁提供兩種輸入方式供使用者自行選用,包含直接輸入數值與調整拉霸滑條。
完成後,網頁將連接對應之Python程式碼進行分析及運算。分析之成果將繪製成一張橫軸為時間,縱軸為收縮或潛變的應變值之圖形,包含潛變柔度函數與潛變係數兩種表示法。為讓使用者更輕易的使用分析完結果,本網頁將提供在動態游標數值顯示之功能,將游標移動至分析結果曲線上欲了解之點位即可得到該點座標值;本網頁也將提供預測數值之CSV檔案下載,所有時間點及其預測數值將分於兩欄儲存於CSV檔中,如此使用者能輕易地運用預測數據於各種分析軟體中。
#Database analysis function
In order to provide users with an understanding of the prediction results and distribution characteristics of various prediction formulas for concrete in different regions and proportion intervals, such as whether there is a deviation of translation or the prediction error of the final value is too large, etc. This page provides the prediction value of each model and the experimental value comparison function, which can be divided into four steps.
1.First of all, you must first select the type of database you want to understand. This page provides data from three databases, including Northwestern University NU database, Japan Civil Engineering Society JSCE database and Taiwan TW database.
2.Choose the type of concrete you want to analyze. This page provides four types of concrete, including compacted concrete, self-compacting concrete, steel fiber compacted concrete and steel fiber self-compacting concrete.
3.Choose the prediction formula you want to use. This page provides a variety of both local and international specifications, including ACI 209R-92, AASHTO, CEB MC90, CEB MC90-99, CEB MC10, GL2000, FIB2000, JSCE1996, JSCE2002, Model B3, Model B4 , Model CCL and Model B4TW and machine learning algorithms, including Decision Tree, ExTra Tree, Random Forest, Extra Trees, Gradient Boosting Regressor and XGBoost, etc. Since this is a scatter diagram, if the function of multiple selection of models is provided, the visibility of the graph will be greatly reduced, therefore only a single selection of models is provided.
4.Enter the parameter interval to be analyzed. This function needs to read various parameters and data of the concrete in the database. For accuracy in the database, all parameters are taken to two decimal places. If the user enters a specific parameter value, it is difficult to have exactly the same data in the database, so this function restricts the user to enter a certain value range, for example, the water-cement ratio is between 0.3 and 0.4 to reduce the possibility of unreadable data.
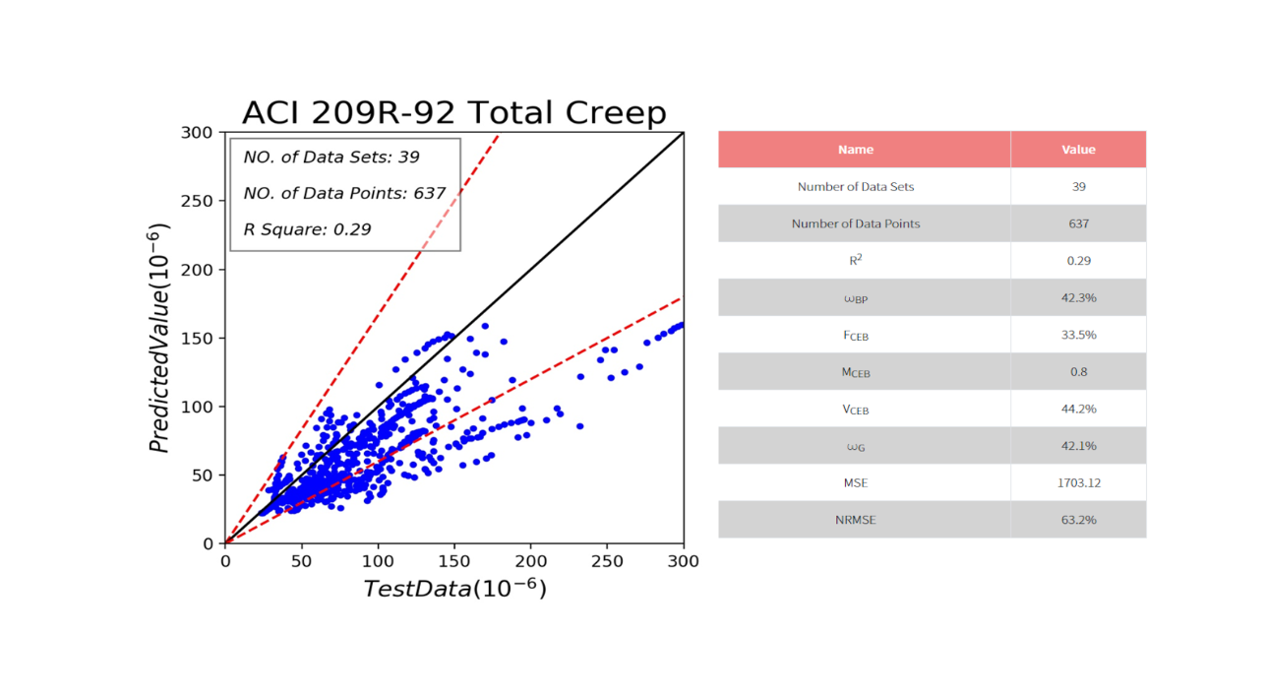
After the above steps are completed, the analysis results of the database can be obtained. The horizontal axis of this analysis result is the experimental data, and the vertical axis is the predicted value of the prediction model. There are three lines that assist in judging the accuracy of the analysis. The 45 degrees black line indicates that the experimental value and the predicted value are exactly the same, and the two red dotted lines represent the cases where the error is approximately 40%; in general, the shrinkage and creep predictions are between the red lines and they are considered to have fairly good accuracy. In order to provide an objective way to determine the quality of the model, this webpage provides a number of statistical indicators for users to choose, including commonly used coefficients of determination and variances proposed by foreign scholars, average difference and mean square error, etc.
#資料庫分析功能
為提供使用者了解不同地區與配比區間的混凝土在各預測式的預測成果及其分布上特徵,例如是否有平移的偏差量或是終值預測誤差過大等等現象,本網頁提供各模型之預測值與實驗值比較功能,其主要可分為四步驟。
1.首先須先選擇欲了解的資料庫種類,本網頁提供三種資料庫之數據,包含美國西北大學NU資料庫,日本土木工程學會JSCE資料庫與台灣TW資料庫。
2.選擇欲分析之混凝土種類,本網頁皆提供四種混凝土類型,包含搗實混凝土、自充填混凝土、鋼纖維搗實混凝土與鋼纖維自充填混凝土。
3.選擇欲使用之預測公式,本網頁提供多種國內外之規範,包含ACI 209R-92、AASHTO、CEB MC90、CEB MC90-99、CEB MC10、GL2000、FIB2000、JSCE1996、JSCE2002、Model B3、Model B4、Model CCL和Model B4TW與機器學習演算法,包含Decision Tree、ExTra Tree、Random Forest、Extra Trees、Gradient Boosting Regressor與XGBoost等等。由於此處為點位散佈圖,若提供模型多選之功能,圖形可視度將大幅降低,因此僅提供模型單選。
4.輸入欲分析之參數區間,本功能需讀取資料庫中混凝土之各項參數與數據,資料庫中為求精確,所有參數皆取至小數點後兩位,若使用者自行輸入特定參數數值,資料庫中難有完全相同之數據,因此本功能限制使用者必須輸入一定的數值區間,例如水灰比介於0.3至0.4,以減少無數據可讀取的情形。
以上步驟完成後便可得到資料庫之分析成果。此分析成果之橫軸為實驗數據,縱軸為預測模型之預測數值,並有著三條輔助判斷分析準確定的線,其中包含45度的黑線代表著實驗值和預測值完全相同,兩條紅色虛線分別代表誤差為正負40%的情況;一般而言,收縮和潛變預測介於紅線之間便被認為有著相當好的準確度。為提供客觀的模型好壞判定方式,本網頁提供多項統計指標供使用者自行選用,其中包含常用的決定係數和國外學者提出的變異數,平均差和均方誤差等等。
#Experimental data upload function
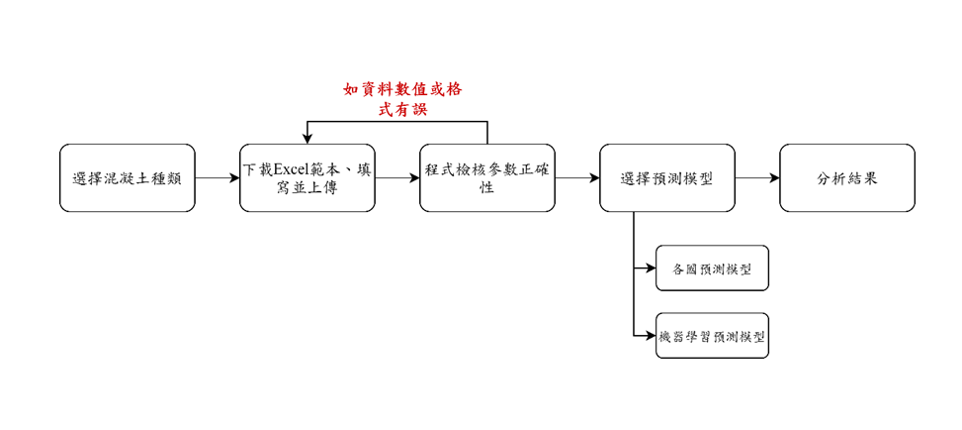
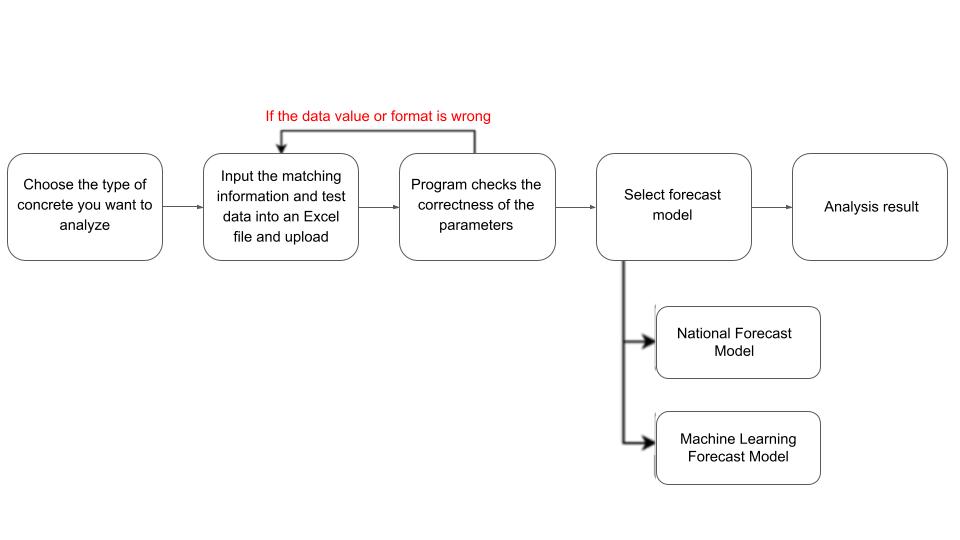
Through this function, users in various countries only need to input the matching information and test data into an Excel file and upload them according to the format specified in this study, and then the results calculated by the selected model can be compared with the uploaded test data. In addition to making it easier for users to compare test results, this feature has also enabled this study to obtain more test data for future regression and analysis of predictive models.
In order to avoid malicious intrusion of web pages and databases, this research has developed the following four corresponding mechanisms to evaluate the rationality and repeatability of the uploaded parameter values and test values to ensure the correctness of the data in the database.
1.This function is only open to users after authentication.
2.The uploaded test data will only be stored in the temporary data form before verification.
3.If the data uploaded by the user contains the source of the document, the webpage will automatically send an email containing the uploaded Excel file to the administrator’s mailbox. Move from the temporary folder to the permanent database.
4.Set the upper and lower limits of various parameters. If the setting range is exceeded or a character string is entered, the page will jump to an error message, and the user is asked to modify it.
#試驗資料上傳功能
透過此功能,各國使用者僅需依據本研究規定之形式,將配比資訊與試驗數據輸入至Excel檔案中並上傳,便可得到所選模型計算出之結果與上傳之試驗數據比較。此功能除了方便使用者比較試驗結果,亦已可使本研究從中獲得更多的試驗數據,以利未來進行預測模型之回歸與分析。
為避免網頁與資料庫受到惡意入侵,本研究研擬下列四種對應機制,以對各項上傳之參數數值與試驗值進行合理性與重複性評估以確保資料庫中資料的正確性。
1.此功能僅開放驗證後之使用者使用。
2.上傳之試驗數據在驗證以前僅存於暫存資料表單。
3.使用者上傳之數據若包含文獻出處,網頁將自動發送一封包含上傳Excel檔案之電子郵件至管理者信箱,管理者將透過尋找該篇文獻,確認上傳之數據與文獻相同後,將其從暫存資料夾移至永久資料庫中。
4.設定各項參事數值上下限,如超越設定範圍或輸入字串則頁面將跳錯誤訊息,並請使用者修改。